
Rust Skins Market Cap
The total value of every Rust skin in circulation, based on Steam prices and estimated supply. Updated hourly.
- High
- $207.00M
- Low
- $115.58M
- Items
- 5,549
| # | Item | Price | 24h | 7d | 30d | Supply | Market cap | Last 30 days |
|---|---|---|---|---|---|---|---|---|
| 301 | 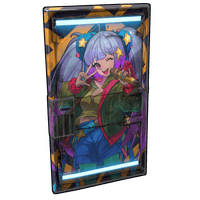 Popstar Door | $4.07 | +1.75% | -3.78% | -18.60% | 22.8K | $92.6K | |
| 302 | 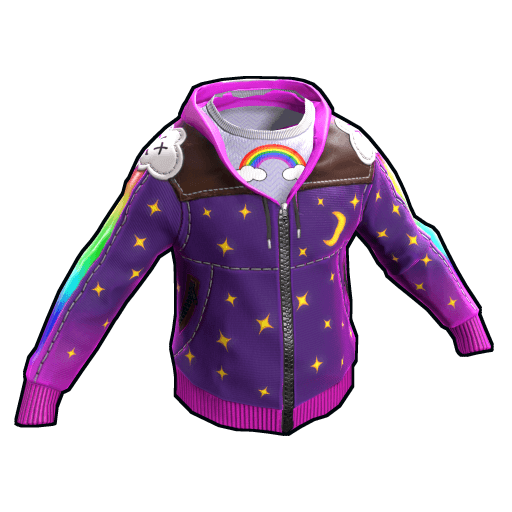 Rainbow Pony Hoodie | $3.63 | +5.52% | -0.82% | -5.96% | 25.5K | $92.5K | |
| 303 |  Silver Leaf Hammer | $8.83 | +5.12% | +12.34% | -14.93% | 10.5K | $92.4K | |
| 304 | 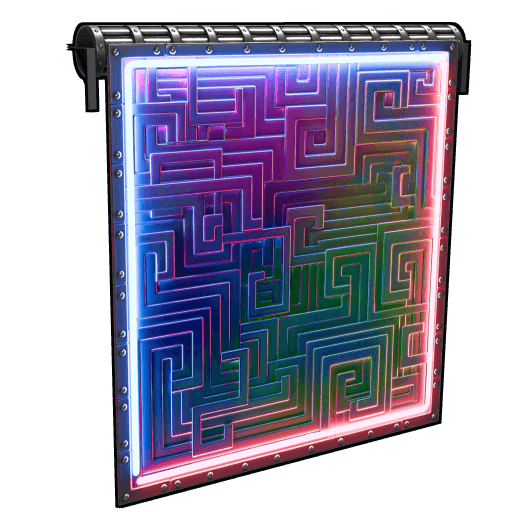 Neon Bismuth Garage Door | $4.08 | +1.75% | -13.74% | -10.92% | 22.6K | $92.4K | |
| 305 | 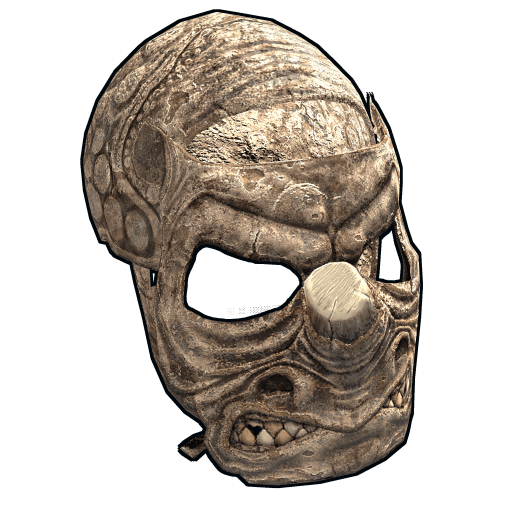 Sand Rhino Facemask | $6.16 | +0.98% | +4.05% | -5.95% | 15.0K | $92.1K | |
| 306 | 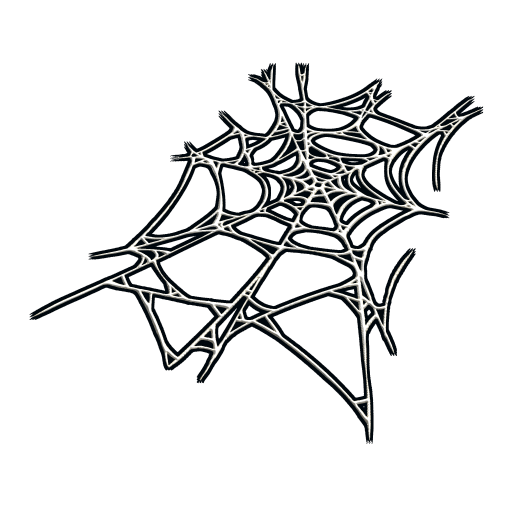 Spider Web Rug | $4.03 | +2.54% | -10.24% | +49.26% | 22.8K | $92.0K | |
| 307 |  Lovestruck Boots | $12.00 | +2.13% | +6.01% | +6.86% | 7,644 | $91.7K | |
| 308 |  Military Chestplate | $6.40 | -3.90% | -9.60% | -14.32% | 14.3K | $91.4K | |
| 309 | 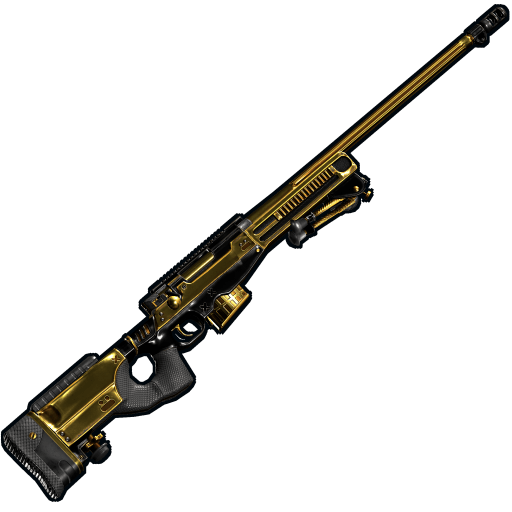 Black Gold L96 | $3.10 | -1.59% | -10.14% | -6.06% | 29.5K | $91.4K | |
| 310 | 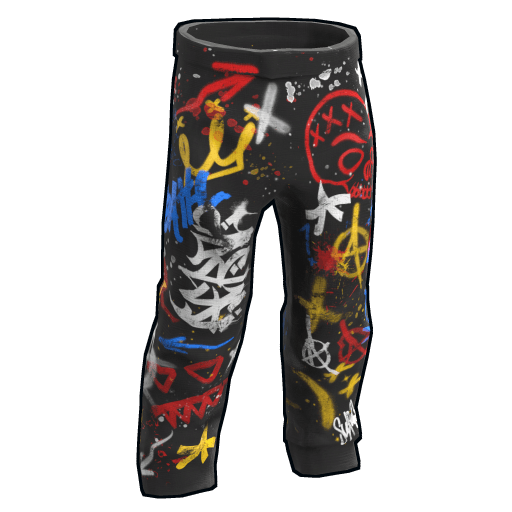 Bombing Pants | $4.49 | -5.67% | -2.39% | -5.47% | 20.3K | $90.9K | |
| 311 | 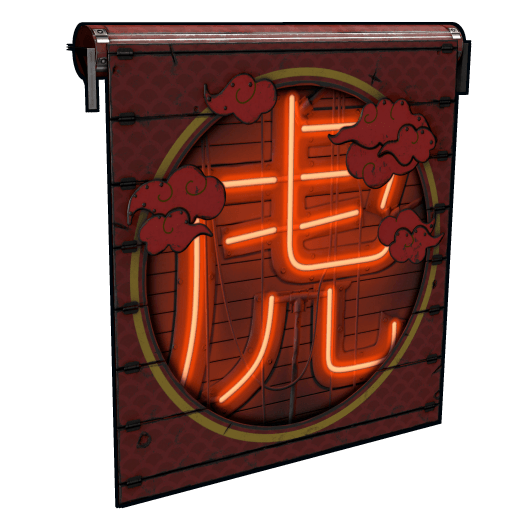 Tiger Garage Door | $2.80 | -6.67% | +6.06% | -12.77% | 32.4K | $90.8K | |
| 312 | 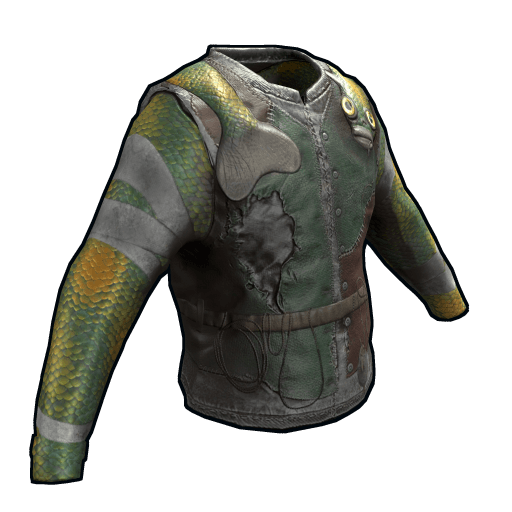 Fish Shirt | $3.36 | +8.39% | +7.35% | -8.45% | 26.9K | $90.5K | |
| 313 | 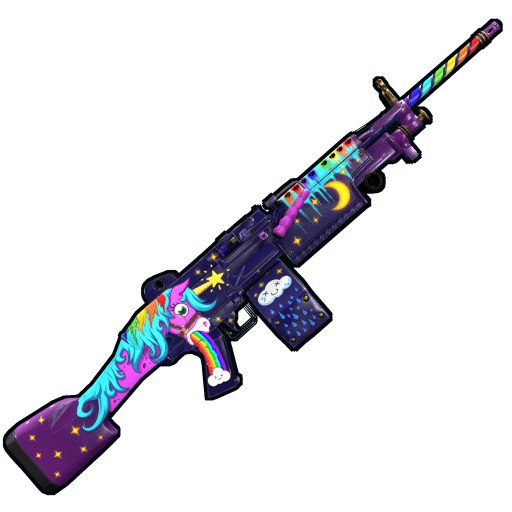 Rainbow Pony M249 | $5.65 | +6.20% | +8.45% | +37.80% | 16.0K | $90.3K | |
| 314 | 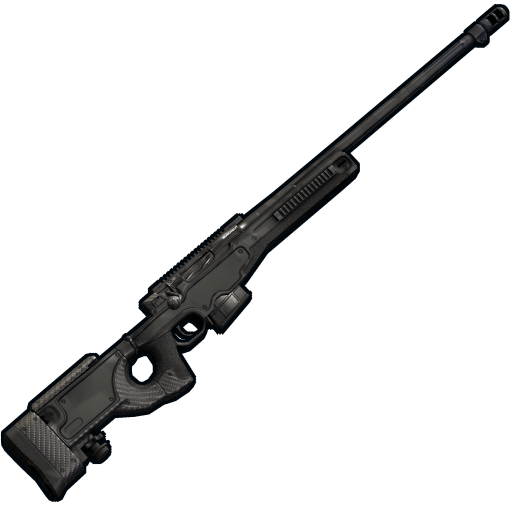 Blackout L96 | $3.49 | -2.24% | +6.40% | -8.40% | 25.8K | $90.1K | |
| 315 | 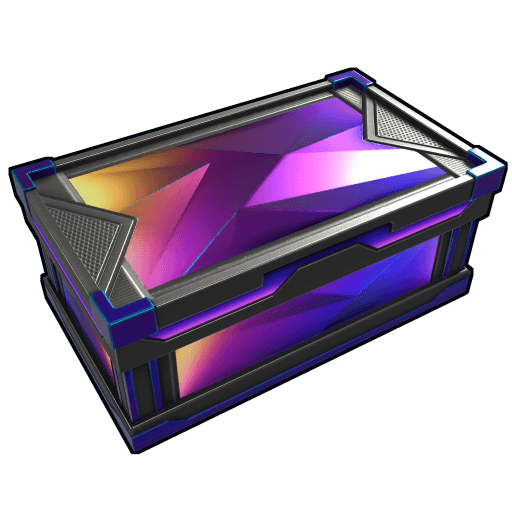 Tempered Large Box | $2.36 | +3.96% | +9.77% | +5.83% | 38.1K | $90.0K | |
| 316 |  Bombshell M249 | $12.35 | +6.65% | +19.32% | +16.95% | 7,276 | $89.9K | |
| 317 |  Sand Rhino Chestplate | $6.26 | +12.79% | +11.99% | +7.38% | 14.3K | $89.7K | |
| 318 | 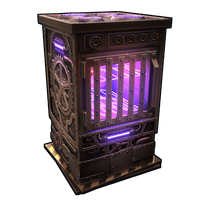 Gear Mechanism Electric Furnace | $5.15 | -3.74% | -12.41% | -7.87% | 17.4K | $89.7K | |
| 319 | 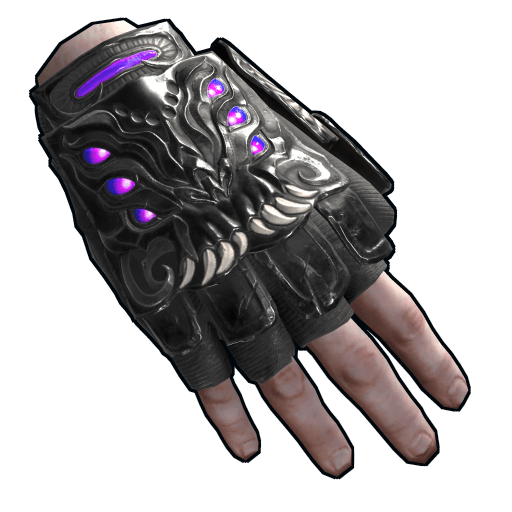 Abyss Roadsign Gloves | $8.74 | +19.56% | +7.24% | -0.91% | 10.2K | $89.4K | |
| 320 | 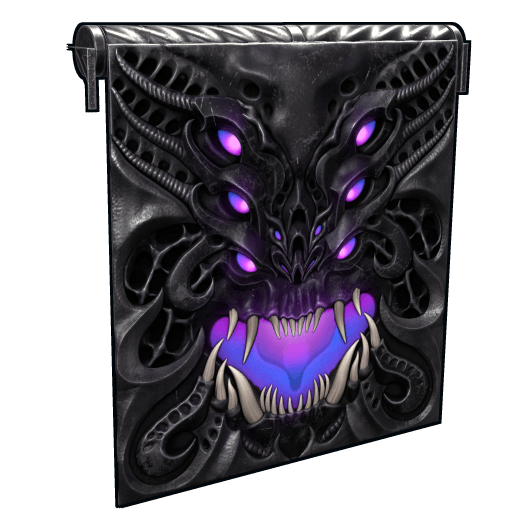 Abyss Garage Door | $2.33 | +2.19% | +10.95% | -6.80% | 38.3K | $89.3K | |
| 321 |  Doodle Hoodie | $5.01 | +2.87% | +6.37% | -16.64% | 17.8K | $89.2K | |
| 322 | 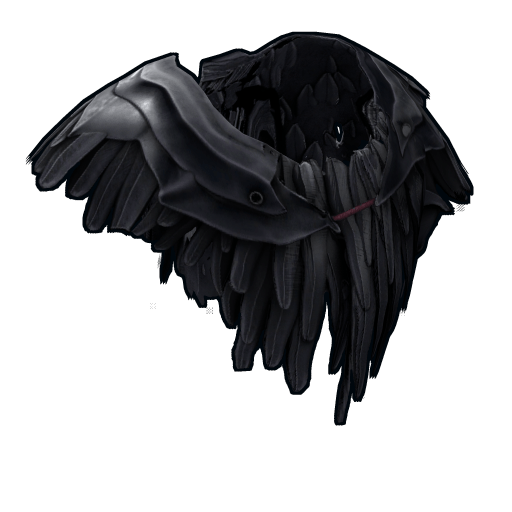 Raven Poncho | $2.30 | -3.36% | -6.12% | +0.88% | 38.7K | $89.1K | |
| 323 |  Blackout BAR | $1.47 | -10.91% | -14.04% | -14.53% | 60.6K | $89.1K | |
| 324 | 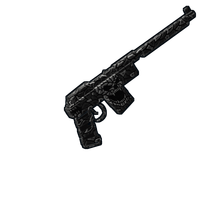 HellCore SAR | $3.24 | +6.23% | -4.14% | -12.43% | 27.4K | $88.8K | |
| 325 | 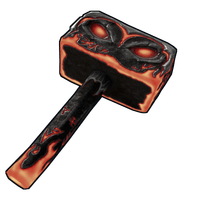 Hammer from Hell | $3.35 | -0.30% | -4.56% | +2.76% | 26.4K | $88.5K | |
| 326 |  Legacy Kevlar Hoodie | $1.61 | +4.55% | +8.05% | +1.26% | 55.0K | $88.5K | |
| 327 | 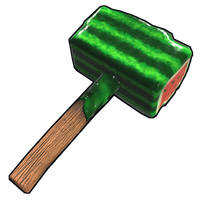 Watermelon Ice Cream Hammer | $4.02 | +1.77% | +6.35% | +9.54% | 22.0K | $88.3K | |
| 328 | 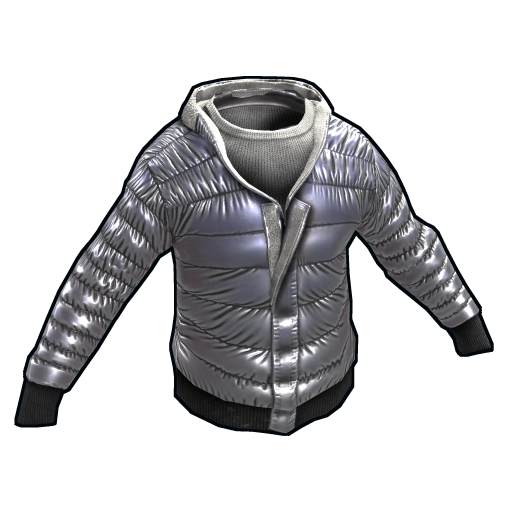 Winter Hoodie | $5.00 | +10.13% | -0.20% | +7.07% | 17.6K | $88.2K | |
| 329 | 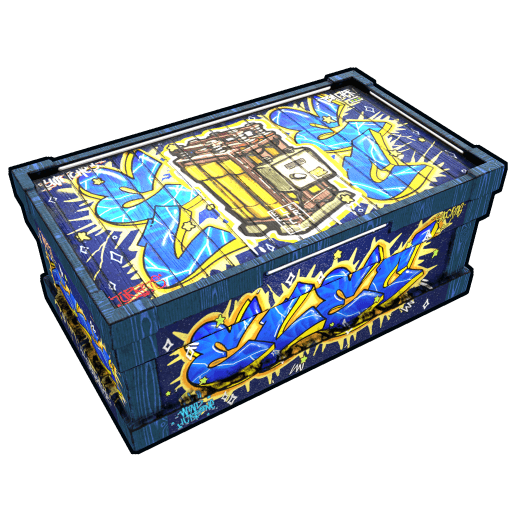 Graffiti Electrical Storage | $5.11 | +1.19% | -4.66% | +13.56% | 17.2K | $88.1K | |
| 330 |  Cow Moo Flage Facemask | $4.71 | -7.28% | +18.05% | +15.16% | 18.7K | $87.9K | |
| 331 | 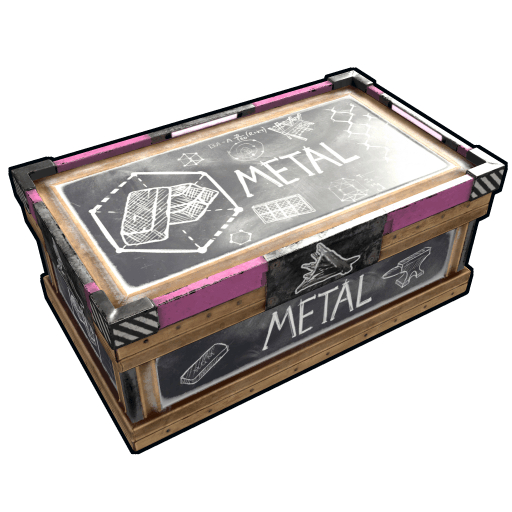 Scientific Metal Storage | $8.33 | +10.33% | +1.09% | +4.52% | 10.5K | $87.9K | |
| 332 | 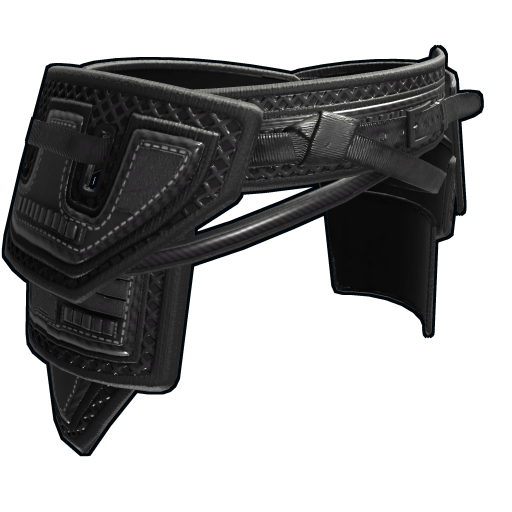 Commando Kilt | $3.53 | -3.02% | +9.63% | -7.59% | 24.8K | $87.7K | |
| 333 |  Island Assault Team Hoodie | $2.90 | +19.34% | +7.01% | -4.92% | 30.2K | $87.7K | |
| 334 | 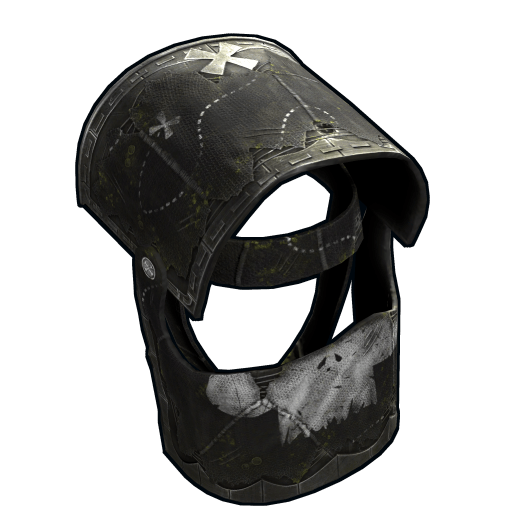 Pirate Helmet | $1.75 | +0.57% | +3.55% | -13.79% | 50.1K | $87.6K | |
| 335 | 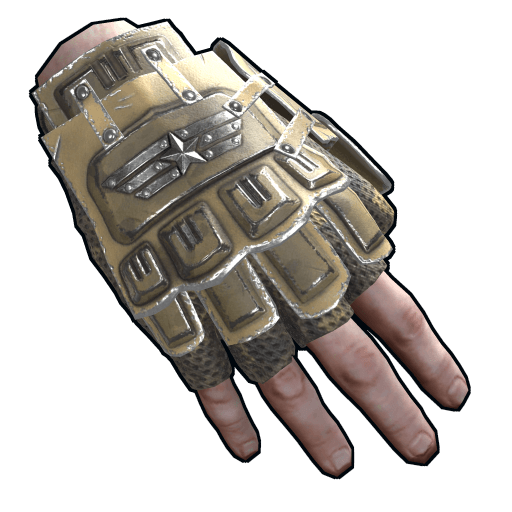 Military Roadsign Gloves | $9.67 | -6.12% | -1.73% | -21.83% | 9,051 | $87.5K | |
| 336 | 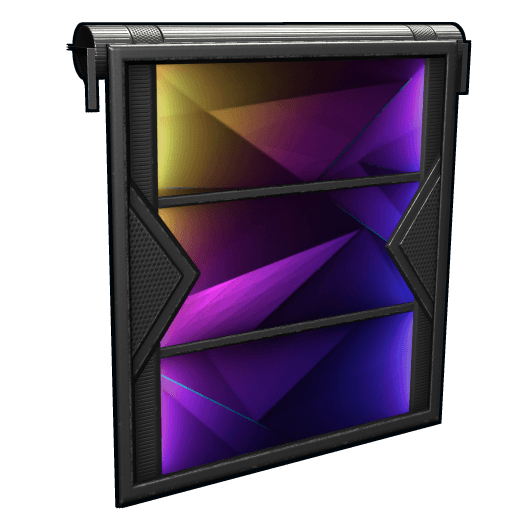 Tempered Garage Door | $6.00 | -4.31% | +1.35% | -19.57% | 14.6K | $87.5K | |
| 337 | 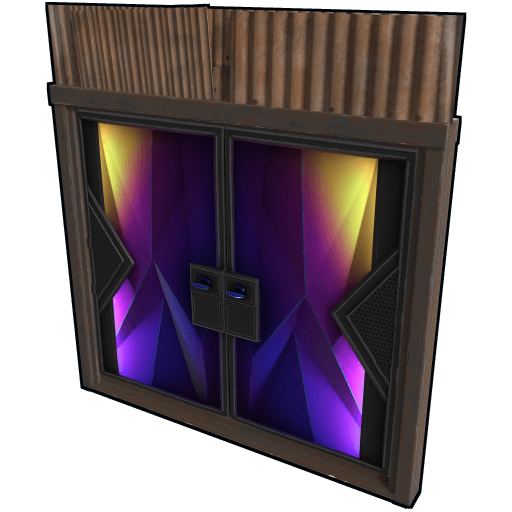 Tempered Sheet Metal Double Door | $4.18 | -6.90% | -10.87% | -16.40% | 20.9K | $87.4K | |
| 338 |  Black Diamond Facemask | $4.18 | -12.18% | -16.06% | -17.06% | 20.9K | $87.4K | |
| 339 | 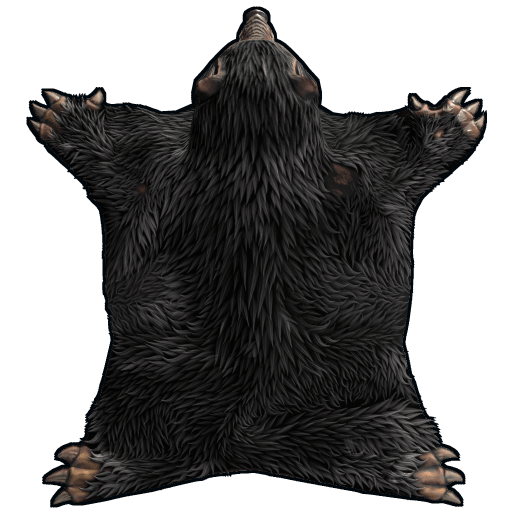 Werewolf Rug | $5.49 | +3.00% | +3.58% | +3.58% | 15.9K | $87.1K | |
| 340 |  Demonic Stone Furnace | $7.95 | +6.85% | +7.87% | +27.20% | 10.9K | $87.0K | |
| 341 | 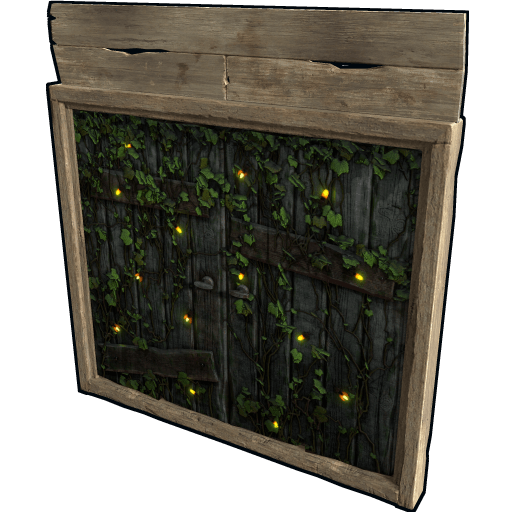 Fireflies Double Wooden Doors | $4.19 | +7.71% | +12.94% | +6.08% | 20.7K | $86.8K | |
| 342 | 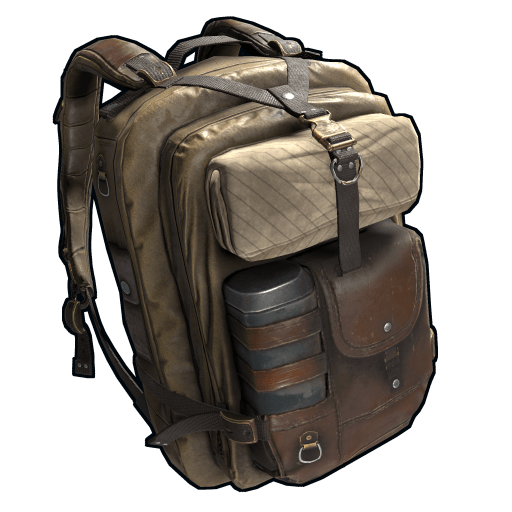 Desert Nomad Backpack | $3.42 | -0.29% | -2.84% | -5.00% | 25.3K | $86.6K | |
| 343 |  Bombing Thompson | $1.17 | +5.41% | +0.86% | -4.88% | 73.8K | $86.4K | |
| 344 |  Shard of True Ice | $53.07 | +2.59% | +4.45% | +3.07% | 1,611 | $85.5K | |
| 345 |  New Year Ox furnace | $1.97 | -1.01% | +2.07% | -10.05% | 43.4K | $85.5K | |
| 346 | 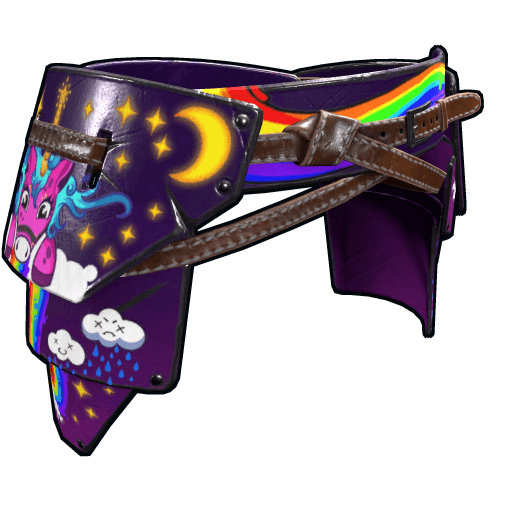 Rainbow Pony Roadsign Pants | $4.03 | +11.02% | +0.25% | -12.77% | 21.2K | $85.4K | |
| 347 | 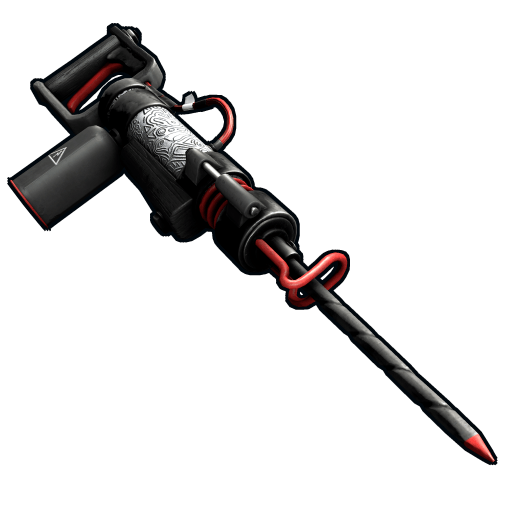 Doodle Jackhammer | $2.11 | -1.86% | +7.65% | +9.90% | 40.4K | $85.3K | |
| 348 |  Porcelain Garage Door | $2.41 | +16.99% | +1.26% | -15.44% | 35.3K | $85.1K | |
| 349 | 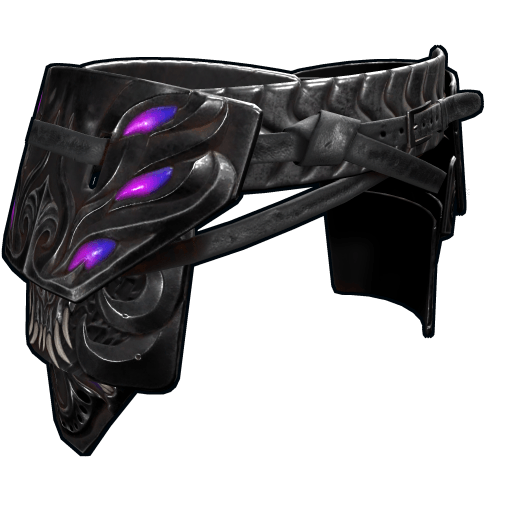 Abyss Kilt | $4.94 | +3.35% | +23.19% | +1.86% | 17.1K | $84.6K | |
| 350 | 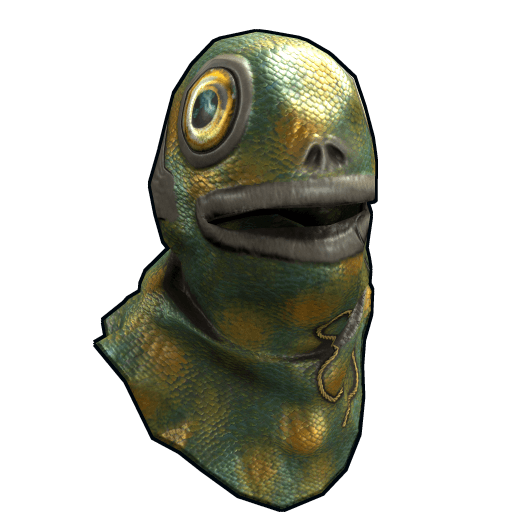 Fish Head | $1.87 | +1.08% | +3.31% | -10.10% | 45.2K | $84.5K |
Frequently Asked Questions
What is Rust skin market cap?
Market cap represents the total estimated value of a Rust skin in circulation. It is calculated by multiplying the current Steam price by the estimated total supply of that item. A higher market cap indicates a larger overall market for that skin.
How is market cap calculated?
Market cap = Steam price × estimated supply. The Steam price is the current lowest listing on the Steam Community Market. Estimated supply is derived from publicly available Steam inventory data and market activity.
What do the 24h, 7d, and 30d changes mean?
These columns show the percentage change in the Steam price over the last 24 hours, 7 days, and 30 days respectively. Green values indicate price increases, and red values indicate declines.
What does the 30-day chart show?
The sparkline is a compact chart of the Steam price over the last 30 days. A green line means the price is higher than 30 days ago, a red line means it is lower.
How is total market cap calculated?
The total market cap is the sum of all individual item market caps — the estimated value of all Rust skins combined on the Steam Community Market.